Introduction
Visual acuity is a crucial aspect of the ophthalmic examination. A complete 8-point eye examination includes testing visual acuity, pupillary examination, evaluation of ocular motility and alignment, intraocular pressure measurement, confrontation perimetry, external examination, slit-lamp examination, and examination of the ocular fundus.
Visual acuity is a quantification of the sharpness or clarity of vision.[1][2] Three terms frequently used when documenting the visual acuity portion of the ophthalmic examination are the Latin abbreviations OU, OS, and OD.[3] The full form of these abbreviations is as follows:
- Oculus uterque (OU) - both eyes
- Oculus sinister (OS) - left eye
- Oculus dexter (OD) - right eye
Other abbreviations include DVA (distance visual acuity), IVA (intermediate visual acuity), and NVA (near visual acuity).[4] The distance for near and intermediate should be mentioned. The DVA, IVA, and NVA may be uncorrected (UDVA, UIVA, UNVA), corrected (CDVA, CIVA, CNVA), or binocular (BDVA, BIVA, BNVA).[4][5]
The numbers obtained from a visual acuity examination are all based on the visual clarity of a normal person at a distance of 20 feet or 6 meters. Suppose visual acuity is documented as 20/20 or 6/6. In that case, this number describes that the patient being examined possesses vision equivalent to that of a normal-sighted person at a distance of 20 feet or 6 meters. If vision is documented as 20/40 or 6/12, a person with this visual acuity can see an image or object at 20 feet that a normal-sighted person could have recognized at a distance as far as 40 feet or at 6 meters compared to 12 meters, respectively.
Visual acuity specifies a threshold. The smallest appreciable retinal image determines the acuity of vision and is the measure of the tiniest object visible at a certain distance. To appreciate the form of an object, its several parts must be recognized. The angle created at the eye's nodal point by the smallest resolvable object is known as the minimum angle of resolution (MAR).
Four Types of Visual Acuity
- Minimum (detectable) visible acuity: This signifies the detection of an object's presence or absence, quantified by the visual angle made at the nodal center of the eye by the tiniest detectable object.
- Minimum (separable) resolvable acuity: This indicates the smallest separation between 2 parts of an object or 2 different objects resolvable as 2 different parts by the visual system. A person of normal sight, measured as 20/20 Snellen equivalent, can differentiate 2 objects that cast a visual angle of 1 minute (60 seconds or 0.017 degrees). Resolvable acuity is determined by the spacing of cones in the retina. However, some people can resolve a stimulus as small as 30 seconds of arc.[6]
- Minimum recognizable acuity: This is denoted by the smallest feature that can be identified or recognized, such as identifying a letter. Although 20/20 is considered the gold standard minimum recognizable acuity in humans, the mean visual acuity in age groups from 18 to 80 may be better than 20/20. The sharpest mean visual acuity was noted in individuals aged 25 to 29.[7]
- Minimum discriminable acuity: This refers to the smallest change in appreciable orientation, position, or size, also known as hyperacuity. The smallest misalignment we can realize is Vernier acuity, named after Pierre Vernier, who invented a scale used to navigate ships. Humans can proficiently detect whether adjacent lines are aligned (as in the Vernier scale), leading to the widespread use of this scale. The Vernier threshold for humans can be as low as 2 to 5 seconds of arc.[8]
Equipment
Tests to Assess Visual Acuity
Tests to assess visual acuity fall into one of the three following groups, with some requiring special equipment.
Detection acuity tests assess the ability to detect the smallest stimulus. Examples of detection acuity tests include:
- Boeck candy bead test
- Catford drum test
- Dot visual acuity test
- Schwarting metronome test
- STYCAR graded balls test
Recognition acuity tests assess the ability to recognize the stimulus. Examples of recognition acuity tests include:
- Bailey-Hall cereal test
- Bailey-Lovie chart
- Beale Collin picture charts
- Early Treatment of Diabetic Retinopathy Study (ETDRS) chart
- Landolt C test
- Lea symbols chart [13]
- Lighthouse test
- Lippman's HOTV test
- Sheridan letter test
- Sjogren hand test
- Snellen charts
- Snellen E test
Resolution acuity tests include:
- Optokinetic drum
- Preferential looking test
Vision Acuity Testing Options for Unique Age Brackets
Visual acuity testing options can vary depending on the age group being assessed. Some considerations for different age brackets include:
Infancy
- Cardiff acuity cards
- Catford drum test
- Fixation test
- OKNOVIS
- Preferential looking test - Teller acuity cards test
- Reflex response
- Visual evoked responses
1 to 2 years
- Boeck candy test
- Sheridan ball test
- Worth Ivory-ball test
2 to 3 years
- Coin test
- Dot visual acuity test
- Miniature toys test
3 to 5 years
- Landolt C
- Lea symbols chart
- Lippman's HOTV test
- Sheridan letter test
- Tumbling E
Other Visual Testing
The Brückner test helps in detecting strabismus. A direct ophthalmoscope is used to obtain a red reflex simultaneously in both eyes. A patient with strabismus shows an increased light reflex in the deviated eye. This test also detects high anisometropia or refractive error.[14]
Relative afferent pupillary defect testing, conducted with a swinging flashlight, is used to detect asymmetric or unilateral optic nerve or retinal disease. This swinging flashlight test is performed in a semi-dark room with the patient looking straight ahead. A bright light source is shone on one eye (A) for 3 seconds. Then, the light is rapidly shifted to the other eye (B). If the pupil of eye B dilates instead of constricting as it usually would, eye B is considered to have a relative afferent pupillary defect. Such a pupil is also called Marcus Gunn pupil.[15]
The cover test can detect the amblyopic eye in a pre-verbal child. Such children resist or cry when the better eye is covered or occluded. However, when the amblyopic eye is covered, there is minimal to no resistance.
Technique or Treatment
Understanding the applications of visual acuity testing and the various testing modalities used is important. The simplest method to evaluate distance visual acuity involves using a Snellen chart.[12][18] Care should be taken to ensure that the patient stands at an appropriate distance from the chart and to test both eyes simultaneously as well as each eye individually. The visual acuity should be recorded as uncorrected (without glasses or contact lenses) and corrected (with glasses or contact lenses) visual acuity.
Methods of Assessing Visual Acuity
The results of visual acuity tests are usually noted with V, VA, or Va. Distance visual acuity is recorded as UCVA (uncorrected visual acuity) or BCVA (best-corrected visual acuity). BCVA is the best visual acuity achieved with refraction. Near vision may be identified by NV. Typically, distance visual acuity is evaluated first. By convention, the visual acuity of the right eye is recorded, followed by the left eye, and then the binocular vision is recorded.
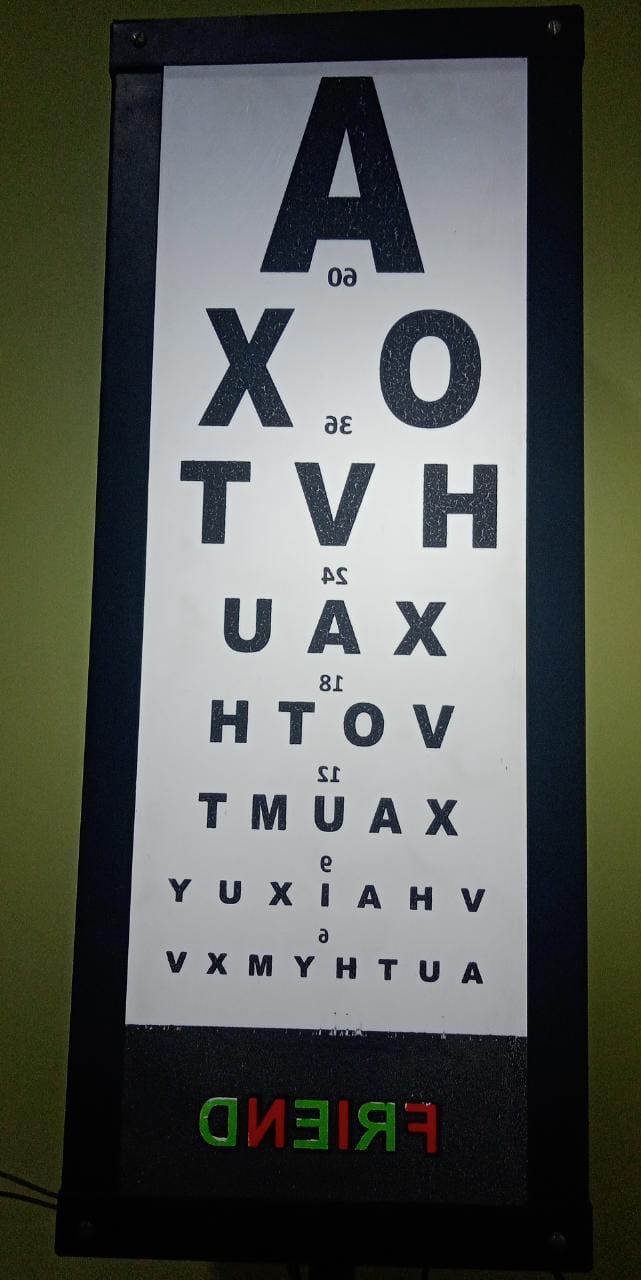
There are many visual acuity testing charts available. These charts can be printed, displayed on a computer or other screen, projected, or used with the help of a mirror. For testing at a distance of 6 meters in smaller examination rooms, a mirror can be placed at a 3-meter distance on the wall opposite the patient seat. The chart is placed on the wall behind the patient, just above their head. This chart is mirrored (horizontally inverted), and the letters become straight when viewed through the mirror (see Image. A Snellen Chart Used in a Small Clinic). The image of the chart is formed behind the mirror at a distance of 6 meters from the patient.
Küchler chart: The Küchler chart, believed to be the oldest known eye chart, was invented by German ophthalmologist Heinrich Georg Küchler in the 1830s or 1840s. The original chart included images of various objects, such as birds, guns, farm equipment, frogs, and others. Küchler later published another chart with 12 rows of letters.
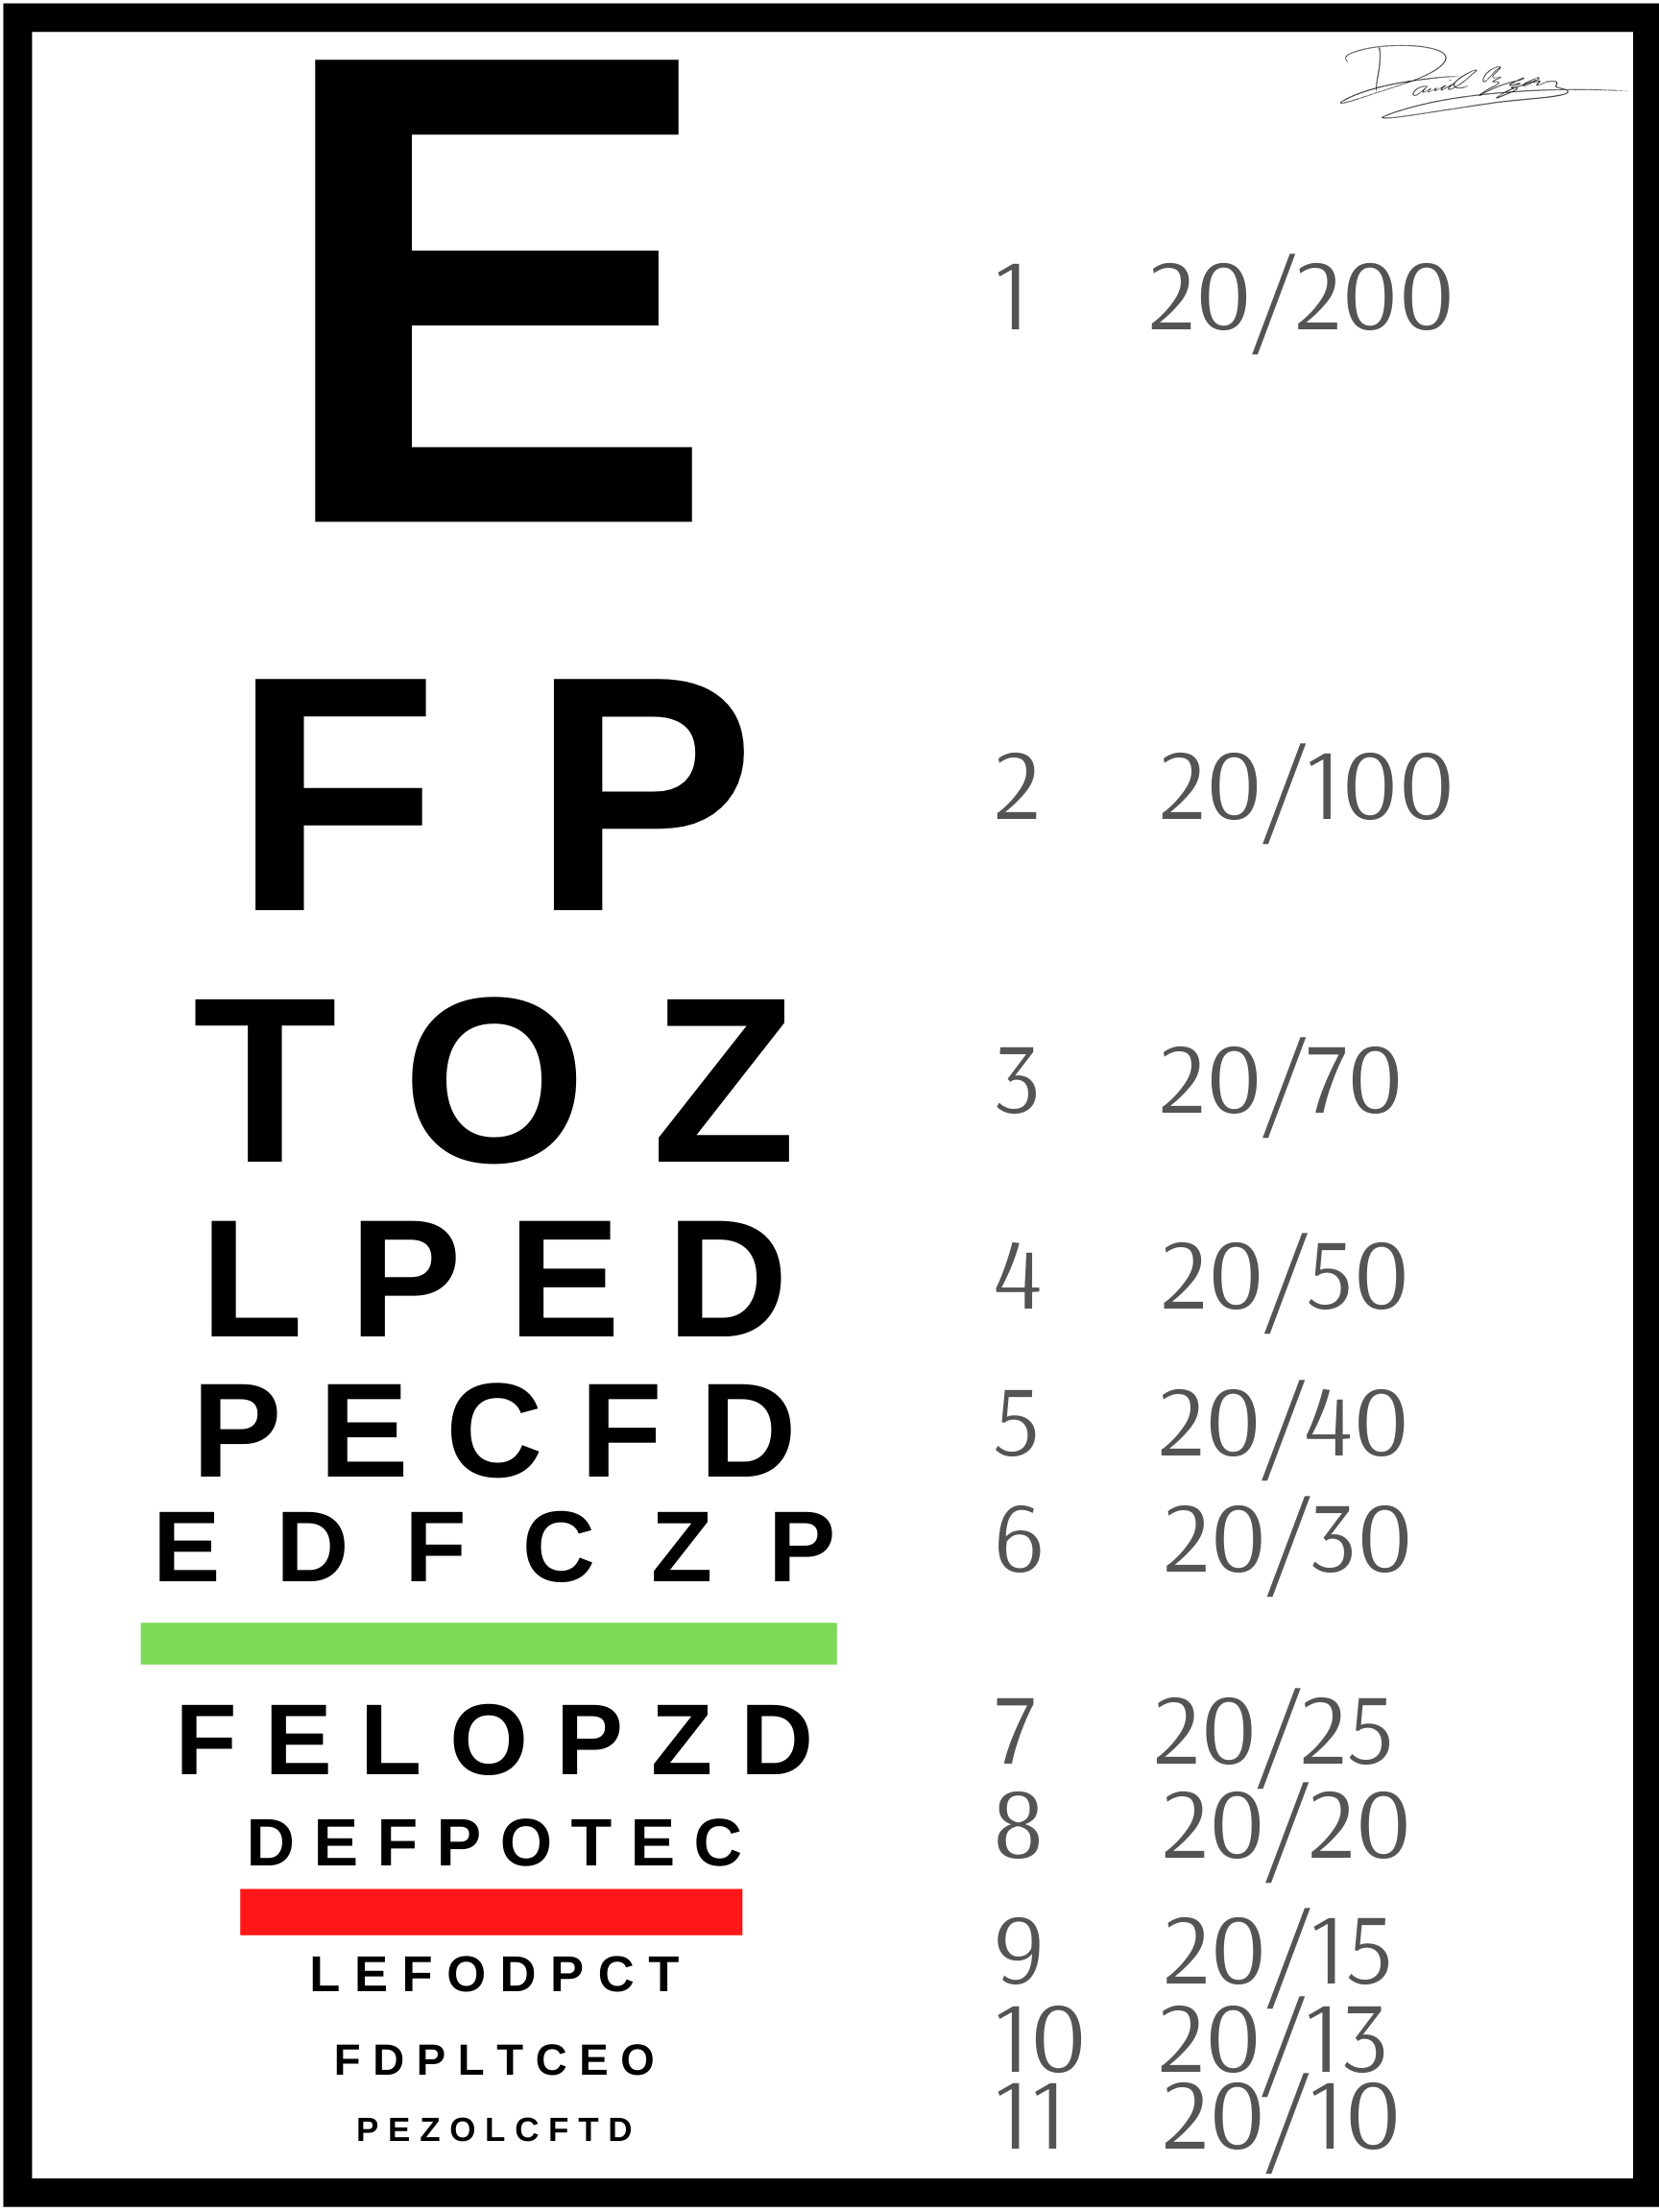
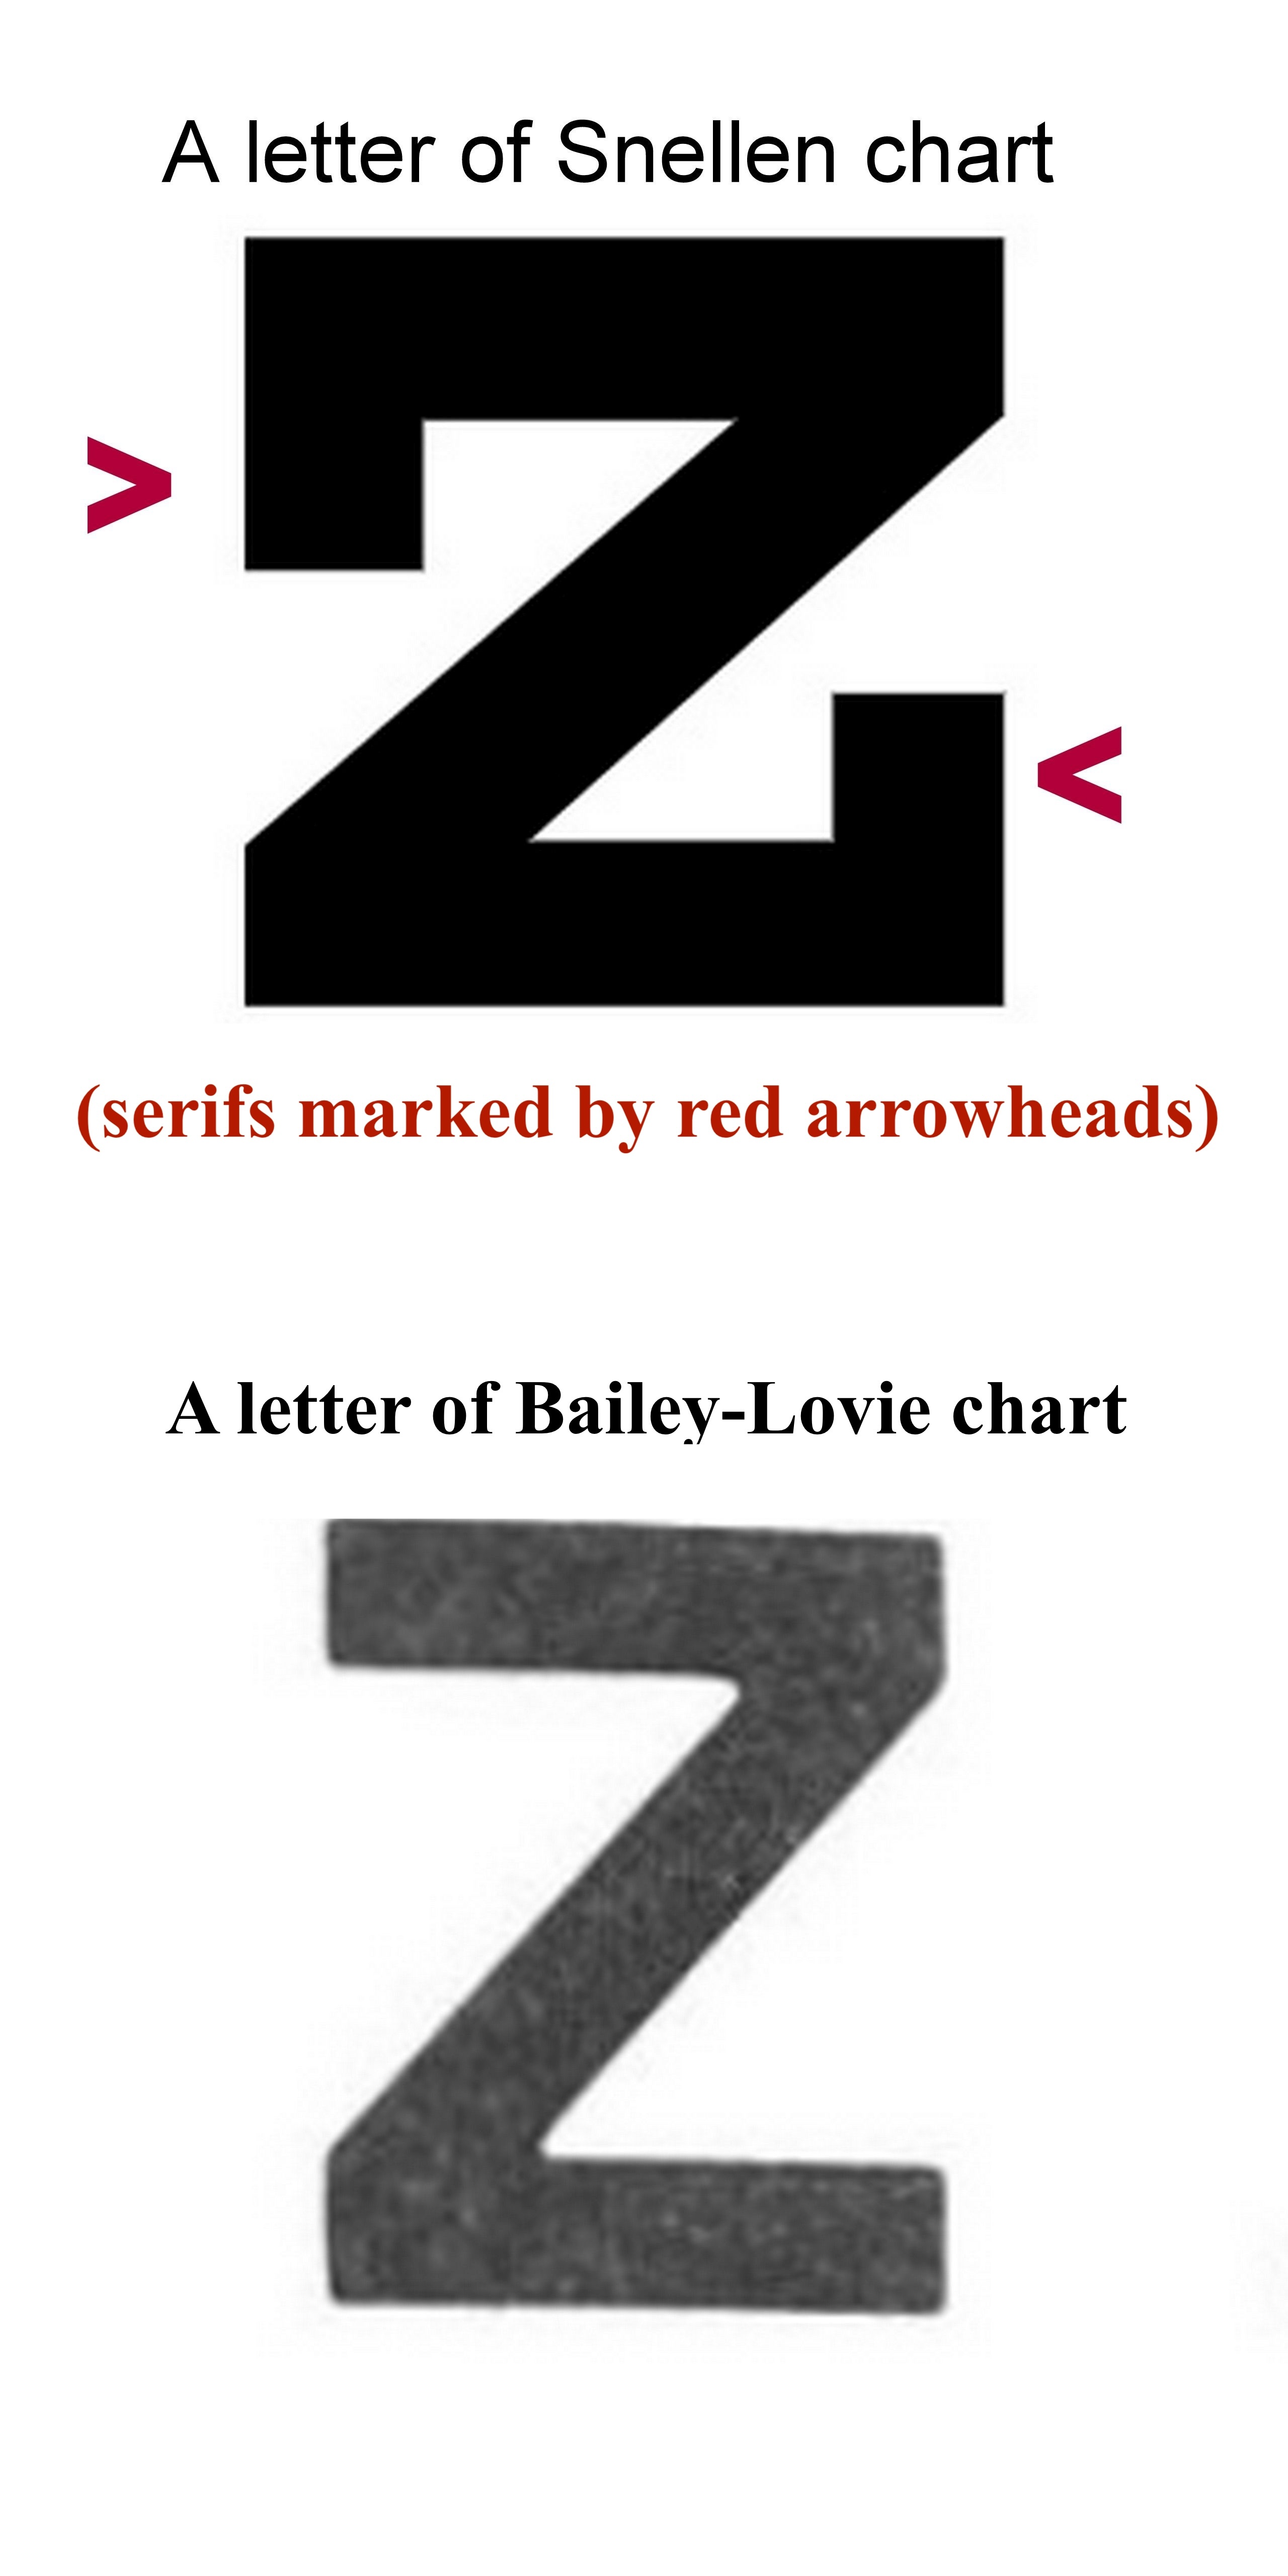
Snellen chart: The Snellen chart was described in 1862 by Herman Snellen, a Dutch ophthalmologist.[18] This chart is very commonly used. The standard distance used for this chart is 20 feet or 6 meters. At this distance, the rays are nearly parallel, and the patient usually does not accommodate to see at this distance. The recommended chart luminance should be 80 to 320 cd/m2.[19] The usual luminance is 160 cd/m2. The Snellen chart has fewer letters in the upper part, and the number of letters increases as the visual acuity tested becomes finer toward the lower part of the chart. The spacing between horizontal letters varies between lines. The letters use serifs. Snellen called the targets used in the chart optotypes (see Image. A Snellen Eye Chart for Visual Acuity Testing).
The vertical height of a 6/6 (20/20) letter when viewed from 6 meters casts 5 minutes of arc at the nodal point of the eye. The vertical height of each arm of E at 6/6 (20/20) line casts an angle of 1 minute of arc; in other words, the thickness of each stroke of the letter is 1 minute of arc. The height and width of the articles are the same (each is 5 times the stroke width). Thus, the height-to-width ratio is 5:5.
The height of a letter at the 6/6 (20/20) line is derived using the formula:
Tan (5 minutes) = height of the letter in meters/6
Or, the height of the letter in meters = 6*tan 5 minutes = 6*0.0015 meter = 0.009 meters = 9 mm.
Similarly, the height of a letter in any line = 6 meters* tan (5x MAR), where MAR is the minimum angle of resolution.
The procedure to calculate MAR in minutes is described later.
The black letters and white backgrounds in each of these charts have high contrast. The contrast is typically higher for a printed chart compared to that for a projector-based one. Therefore, the projector-based chart should be used in a dark room.
The size change from one line to another is not uniform. The size of a 6/36 letter is 60% of the 6/60 (20/200) letter. On the other hand, the size of a 6/6 (20/20) letter is 66% of a 6/9 (20/30) letter. Another issue with the Snellen chart is that finer visual acuity has more letters, which makes it difficult to read smaller letters due to the crowding phenomenon. This problem is especially true in patients with amblyopia. The letters used may not have similar legibility.[18] Reportedly, errors were more common with certain letters (S, F, C, B) compared to others (A, L, T, Z).[20]
There are 7 lines in the Snellen chart. The usually denoted visual acuity in each line is as follows, from the uppermost to the lowermost line:
- 6/60 (20/200) (contains one letter)
- 6/36 (20/120) (two letters)
- 6/24 (20/80) (three letters)
- 6/18 (20/60) (four letters)
- 6/12 (20/40) (five letters)
- 6/9 (20/30) (six letters)
- 6/6 (20/20) (seven letters)
As the lower rows have more letters, the chart has an A-shaped appearance from a distance.
John Green chart: The John Green chart, introduced in 1868, used sans-serif letters and had up to 11 letters in each row. The spacing between letters was proportionate, and there was a geometric progression of the letter size in different rows (see Image. Serifs in Snellen Chart).
The LogMAR chart: To overcome the limitations of the Snellen chart, Bailey and Lovie introduced the LogMAR chart in 1976.[21] (see Image. Serifs in Snellen Chart). Such charts may provide higher sensitivity and reliability in measuring visual acuity.
LogMAR is the abbreviation of log (base 10) of the MAR (expressed in minutes). For statistical analysis, logMAR visual acuity is the preferred option.[22]
The key features of the Bailey-Lovie LogMAR chart are as follows:
- The letters (optotypes) have equal recognition legibility and difficulty. This chart uses 10 sans-serif letters from the British Standard test charts for checking visual acuity as advocated by the British Standard Institution in 1968.
- There are five letters on every line.
- The height of a letter is 5 times the stroke width, and the width of a letter is 4 times the stroke width. Thus, the ratio of height to width for each letter is 5:4.
- The distance between each letter in a single line is equal to the width of the letters (uniform inter-letter spacing). This creates a similar contour interaction within each line and possibly a similar crowding effect.
- The distance between 2 rows is the height of the letters in the lower row (uniform inter-line or inter-row spacing).
- The ratio of the size of each letter in one line to the adjacent line is constant (geometric progression or progression in logarithmic steps). Weber Fechner's law states that the perceived intensity of a stimulus is proportional to the logarithm of the intensity of the stimulus. Therefore, the fixed difference between adjacent lines is 0.1 Log unit (the lower line has less value than the upper line). This translates to a size change of around 1.25 times or the 10th root of 10 (upper line letters being larger).
- Each letter has a logMAR value of 0.02 in each line.
- The Snellen notation (for example, 6/60 (20/200), 6/48 (20/160)) and logMAR values (1, 0.9, 0.8) are given on either side of each row when viewed from a 6-meter distance.
- For nonstandard testing distance, the distance may be changed in a logarithmic scale at 0.1 log unit steps. The possible distances are taken in geometric progression (multiplication by 0.8), including 6, 4.8, 3.8, and 3 meters. Notably, these distances can be remembered by dividing the denominator of the Snellen notations of different rows (such as 6/60, 6/48, 6/38, and 6/30) of this chart by 10. Depending on the distance used, a correction factor is added to the logMAR value noted in the chart. For a distance of 4.8 meters, the correction factor is 0.1; for 3.8 meters, it is 0.2; for 3 meters, it is 0.3, and so on. The correct logMAR value of VA at a distance is the sum of the logMAR value of the lowest row viewed plus the correction factor for the distance. For example, if a person views the 6/30 (logMAR 0.7) row at 4.8 meters (correction factor 0.1), the corrected visual acuity in logMAR is 0.7+0.1=0.8. For a distance of 7.5 meters, the correction factor is −0.1 (minus point one). Nonstandard testing distances may be required for the following.
- Nonstandard design of the examination room
- Patients with low visual acuity
- Malingering
- Validation of visual acuity scores
- The chart size is 80 cm (height) x 70 cm (width).
- Chart appearance is V-like when viewed from a distance.
Disadvantages of the chart include longer examination times and larger chart sizes.
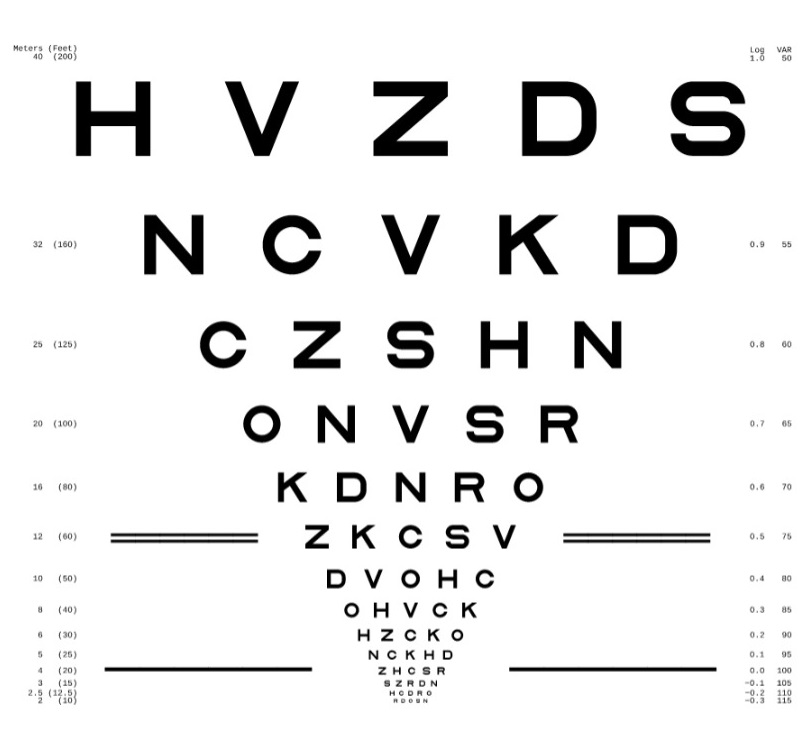
The most commonly used LogMAR charts are the Bailey-Lovie and ETDRS charts (see Image. ETDRS Chart).
ETDRS chart: The ETDRS chart was described by Ferris and colleagues at the National Eye Institute, United States.[23] The ETDRS chart uses a luminance of 160 cd/m2.[19] Each optotype (Sloan letter, see below) has the same height and width; the ratio is 5:5. Thus, these letters are wider compared to the letters of the Bailey-Lovie chart. The ETDRS chart was designed to be read at a distance of 4 meters instead of 6 meters.[23] The ETDRS chart may, therefore, be used to check visual acuity in smaller examination rooms.
The Snellen fraction at 4 meters may be converted to conventional American notation by multiplying the numerator and the denominator by 5. Thus, 4/5 is equivalent to 20/25. At 4 meters, the visual acuity is maximum, and the dispersion of visual acuity is minimum.[24] Refraction for infinity can be calculated by deducting 0.25 diopter from the refraction at 4 meters. Nonstandard distances used with the ETDRS chart are taken in a geometrical progression (3.2 m, 2.5 m, 2 m, 1.6 m). The height and width of the chart are 60.3 cm and 63.5 cm, respectively. The reading of a single letter is allowed once only.
Other Visual Acuity Testing Charts
Other tests to evaluate visual acuity include the Golovin–Sivtsev table, the Freiburg Visual Acuity Test (FrACT, automated self-administered computerized test), and various charts such as the Waterloo, Rosebaum, Monoyer, and Regan charts.[25]
The Waterloo chart arranges letters in a column, but this may reduce visual acuity as recognizing letters in rows is easier than in columns due to a psychophysiological phenomenon.[26] In the Monoyer chart, the lowest line has the largest letters, and the name Monoyer is spelled out when reading the leftmost letters upwards. This chart stands as one of the oldest vision charts available.
Optotypes: The standardized letters and shapes used to test visual acuity are called optotypes. Various optotypes are used to test visual acuity.
- Landolt C chart: There are 4 configurations of the letter C, with the opening facing up, down, right, or left. Each configuration has a similar legibility. Therefore, the chance of randomly guessing the correct response is 25% (1 in 4).
- Illiterate E chart: There are 4 configurations of the letter E, with the opening facing up, down, right, or left. Therefore, the chance of randomly guessing the correct response is 25% (1 in 4).
- Letters:
- When all letters are used, the chance of randomly guessing the correct letter is low (1/26 or around 4%).
- The ETDRS chart uses Sloan letters, named after Louise Sloan. There are 10 Sloan letters, and the guess rate is 1/10, or 10%. The Sloan letters include C, D, H, K, N, O, R, S, V, and Z. The characteristics of the Sloan letter include equal difficulty in recognition of each letter compared to the Landolt C chart.
- The Bailey-Lovie chart used the British set of 10 letters, and the guess rate is 10%. These letters are D, E, F, H, N, P, R, U, V, and Z.
- Other optotypes, primarily used for children, include Allen pictures and symbols.
Procedure for Checking Visual Acuity
The smallest recognized optotype for visual acuity is documented using at least one of the following notations: the British or American Snellen fraction (6/6 or 20/20, respectively), the decimal acuity, or the logMAR.
For the Snellen chart, the patient is 6 meters away from the chart. Standard room illumination is used except for projector-based vision charts, where a darkened or dim room is preferred. The usual contrast of the visual acuity charts is at least 80%. If the person reads only the top letter of the Snellen chart, visual acuity is documented as 6/60; the top letter, which should be read at 60 meters, is being read at 6 meters. The same visual acuity is written as 0.1 on the decimal scale and 20/200 per the American standard for the Snellen fraction. Visual acuity of 6/60 is equivalent to +1.00 on the logMAR scale.
Similarly, if the line that should be read at 36 meters is being read at 6 meters, then it should be documented as 6/36, 0.16 on the decimal scale, or 20/120. Visual acuity of 6/36 is equivalent to +0.78 on the logMAR scale. This progression can continue to the seventh line, documented as 6/6, 1.0 on the decimal scale, +0.00 on the logMAR scale, or 20/20 as the Snellen equivalent.
The distance is gradually reduced if the patient cannot read 6/60 at 6 meters. If the top letter is visible at a distance of 5 meters, this is documented as 5/60. If it is visible at 4 meters, it is noted as 4/60. If the top letter cannot be visible at 1 meter, the patient is asked to count fingers; the examiner holds a certain number of fingers close to the patient's face. Counting fingers at 6 meters is typically considered equivalent to 6/60, as the size of the 6/60 letter is roughly similar to a finger. Similarly, finger counting at 5 meters is around 5/60, and so on. Finger counting can be utilized to check visual acuity at the bedside if a vision chart is unavailable. Hand movement or hand motion is tested in a patient who cannot count fingers close to the face.
For hand motion visual acuity, one eye is closed. A light is illuminated from behind the patient over a hand kept 60 cm in front of the eye. The patient is instructed to indicate whether the hand is not moving, moving up-down, or moving right-left. If the patient gives a correct response, including the direction of movement, at least 4 of the 5 times they are tested, then hand motion visual acuity is documented as present.[27]
The projection of rays is examined by closing the unaffected eye and asking the patient to correctly detect the direction from which the light from an indirect ophthalmoscope is projected onto the eye (superior, inferior, nasal, or temporal). The responses of projection of rays are recorded as + (present) or − (absent) in these quadrants. Light perception is assessed when the patient cannot appreciate hand movements. The light of an indirect ophthalmoscope set at maximum illumination is shone over the eye from the front at a distance of 90 cm. The patient is asked if the presence of light is appreciated or not.[27] Testing light perception with the potentially unaffected eye before examining the affected eye may help the patient cooperate and better comprehend the test. Perception vision and no perception vision may not be quantifiable for statistical analysis.[22]
Testing Near and Intermediate Vision
The distance used for near vision testing may vary depending on the work or occupation of the patient. Common testing distances include 25, 30, 33, 35, or 40 cm, with 33 cm being the most common. Charts for testing near vision include the Snellen, Times New Roman, or Jaeger near vision charts. In addition, charts for evaluating intermediate vision are available; testing is typically conducted at a distance of 66 cm or 80 cm.
Representation and Documentation of Visual Acuity
As previously mentioned, many different nomenclatures are available to represent or document the results of visual acuity testing. British (test distance of 6 meters) and American (test distance of 20 feet) Snellen fractions are commonly used and described above.
The decimal fraction value is determined by dividing the numerator of the Snellen fraction by the denominator. For instance, in the Snellen fraction 6/60, dividing 6 by 60 equals 0.1, which represents the decimal fraction value.
The MAR is the angle created at the nodal point of the eye documented in minutes and is derived by dividing the denominator of the Snellen fraction by the numerator. Thus, in the Snellen fraction 6/60, dividing 60 by 6 equals 10; this value, expressed in minutes, represents the MAR.
The logMAR is the logarithm of MAR in minutes; the base is 10. For a Snellen fraction of 6/60, the MAR is 10, and the logMAR is 1. For a Snellen fraction of 6/6, the MAR is 1, and the logMAR is 0.
Spatial frequency is expressed as cycles per degree (cpd), calculated by multiplying the decimal fraction value by 30. For example, in a Snellen fraction of 6/60, the decimal fraction is 0.1, equivalent to a spatial frequency of 3 cpd.
Louise Sloan introduced the M-unit (M) notation for the size of the optotype by converting the Snellen system to the metric system and using the formula decimal fraction value = test distance in meters (m)/letter size (M). According to the International System of Units, a patient with a visual acuity of 20/20 can recognize a letter of 1M size at 1 meter. Similarly, a normal eye can see a letter of 20M in size from 20 meters.
The visual acuity should document the following details if possible.
- Distance/near/intermediate (preferably with working distance for each)
- Right eye/left eye/both eyes
- Aided (with power and detail of refractive correction)/unaided
- Type of vision chart (LogMAR chart is preferred)
- The luminance of the chart
- Rule for scoring
- Rule for termination
- Projection of rays in each eye(if visual acuity is the perception of light or better)
- Number of individuals measuring visual acuity and their training
- Details of autorefraction, retinoscopy, and subjective refraction (with the method of subjective refraction) [28]
The reporting standard for visual acuity varies depending on the journal. Various preferences include 20/20 format, 6/12 format, and logMAR format (with 2 decimal places).
Clinical Significance
Visual acuity testing can have a significant clinical impact. Vision loss may be a feature of ocular diseases or a clue to diagnosing systemic diseases or diseases of other systems, including the central nervous system.
Visual acuity should be used in conjunction with other ophthalmologic tests such as pupillary examination, intraocular pressure measurement, visual field testing, refraction, slit-lamp examination, and retinal examination. The best-corrected visual acuity in healthy eyes may show variation with age. A study involving 400 eyes of 200 individuals aged 25 to 74 found that until 64, healthy eyes typically exhibit vision better than 20/20 (or logMAR 0). The study noted that mean BCVA in healthy eyes remained constant (better than logMAR −0.10 or 20/15) from 25 to 54 years, followed by an age-related breakpoint at 55 to 59 years, and after 60 years, the visual acuity declined (between logMAR 0 or 20/20 and logMAR −0.10 or 20/15).[29]
In addition to vision charts, the following techniques are used when evaluating visual acuity in preverbal children.
- Optokinetic nystagmus testing: This testing in infants involves passing a series of black and white stripes in front of the infant to elicit nystagmus.
- Preferential-looking test: This can be used to evaluate visual acuity in infants. When an infant is presented with two visual stimuli, one striped and the other plain, the infant with normal visual acuity looks at the striped pattern for a longer time. This is the basis of the Cardiff Acuity Test and Teller Acuity Cards II testing.
- Visual evoked response/potential testing: This method evaluates the electroencephalogram response recorded from the occipital lobe in response to visual stimuli. A sweep-visual evoked potential is performed by showing the preverbal child a pattern of grids or bars. A response is noted when the stripes are prominent enough for the child to see (discriminate). For smaller stripes, no impulse is generated.[30][31]
Many studies in ophthalmology have recorded visual acuity using a Snellen chart, and then the Snellen visual acuity is converted to logMAR value using a conversion chart (see Table 1. Conversion of LogMAR to Snellen Equivalents).
Table 1. Conversion of LogMAR to Snellen Equivalents.[22]
| logMAR |
Snellen Equivalent |
| 3 |
20/20,000 (or hand movements at 2 feet) |
| 2 |
20 /2000 (or finger counting at 2 feet) |
| 1.60 |
20/800 |
| 1.30 |
20/400 |
| 1.20 |
20/320 |
| 1.18 |
20/300 |
| 1.10 |
20/250 |
| 1 |
20/200 |
| 0.90 |
20/160 |
| 0.88 |
20/150 |
| 0.80 |
20/125 |
| 0.76 |
20/114 |
| 0.70 |
20/100 |
| 0.60 |
20/80 |
| 0.54 |
20/70 |
| 0.50 |
20/63 |
| 0.48 |
20/60 |
| 0.40 |
20/50 |
| 0.30 |
20/40 |
| 0.20 |
20/32 |
| 0.18 |
20/30 |
| 0.10 |
20/25 |
| 0.00 |
20/20 |
| −0.10 |
20/16 |
| −0.20 |
20/12.5 |
| −0.30 |
20/10 |
Although conversion tables are available to convert Snellen fraction to logMAR, such conversion may falsely measure the visual acuity to be worse compared to directly measuring the visual acuity with logMAR charts, specifically in individuals with low vision. Therefore, caution should be exercised while analyzing converted Snellen values to logMAR.[32][33][34][35] (see Table 2. LogMAR Equivalencies for Snellen Visual Acuity Measurements). The repeatability of visual acuity measurements using the LogMAR chart was noted to be 2 times of the Snellen chart.[28][36] LogMAR charts and Glasgow acuity cards may be more sensitive to interocular differences in visual acuity compared to Snellen charts or traditional single-letter acuity tests in young children and, hence, may be more sensitive in detecting amblyopia.[37] Thus, there may be a poor or unacceptable agreement between the Snellen chart and the current gold standard LogMAR chart.[28] Few authors recommend that the time may have come to confine Snellen charts to the annals of history.[36] Snellen chart, by the inherent restriction of the stimulus size, has the effect of truncating the upper limit of the scale, producing, in statistical terms, an incomplete distribution, and the irregular progression of letter size along with the design of the chart may not allow parametric statistics to be employed.[28][38] Therefore, the conversion of Snellen visual acuity to logMAR using a conversion chart and subsequent analysis of the data has been discouraged.[28] Data are better measured using LogMAR charts for a reliable analysis of visual acuity measurements.[36] However, despite these limitations, the Snellen chart is present in many clinics due to its ease of use and the familiarity it offers compared to the LogMAR chart. Some journals prefer the term corrected distance visual acuity over best-corrected visual acuity. Most journals need the authors to report the mean visual acuity and range of visual acuity in Snellen format for better comprehension. LogMAR values should be used to measure mean visual acuity rather than decimal or MAR values.[39]
Table 2. LogMAR Equivalencies for Snellen Visual Acuity Measurements.
|
20 ft
|
6 m
|
Decimal
|
4 m
|
MAR
(in min)
|
logMAR
|
|
20/630
|
6/190
|
0.032
|
4/125
|
31.5
|
+1.5
|
|
20/500
|
6/150
|
0.04
|
4/100
|
25
|
+1.4
|
|
20/400
|
6/120
|
0.05
|
4/80
|
20
|
+1.3
|
|
20/320
|
6/95
|
0.06
|
4/63
|
16
|
+1.2
|
|
20/250
|
6/75
|
0.08
|
4/50
|
12.5
|
+1.1
|
|
20/200
|
6/60
|
0.1
|
4/40
|
10
|
+1.0
|
|
20/160
|
6/48
|
0.125
|
4/32
|
8
|
+0.9
|
|
20/125
|
6/38
|
0.16
|
4/25
|
6.25
|
+0.8
|
|
20/100
|
6/30
|
0.2
|
4/20
|
5
|
+0.7
|
|
20/80
|
6/24
|
0.25
|
4/16
|
4
|
+0.6
|
|
20/63
|
6/19
|
0.32
|
4/12.5
|
3.15
|
+0.5
|
|
20/50
|
6/15
|
0.4
|
4/10
|
2.5
|
+0.4
|
|
20/40
|
6/12
|
0.5
|
4/8
|
2
|
+0.3
|
|
20/32
|
6/9.5
|
0.63
|
4/6.3
|
1.6
|
+0.2
|
|
20/25
|
6/7.5
|
0.8
|
4/5
|
1.25
|
+0.1
|
|
20/20
|
6/6
|
1.0
|
4/4
|
1 |
0
|
|
20/16
|
6/4.8
|
1.25
|
4/3.2
|
0.80 |
−0.1
|
|
20/12.5
|
6/3.8
|
1.6
|
4/2.5
|
0.625 |
−0.2
|
|
20/10
|
6/3
|
2.0
|
4/2
|
0.5 |
−0.3
|